Facebook is the undisputed leader of social media platforms. For marketers, excelling at Facebook is a must, regardless of their industry and audience demographics. Marketers who pivot their marketing strategies around hard numbers and facts have a better chance of making their mark on Facebook.
However, the platform and its audience evolve at breakneck speed. The marketing tactics that worked last year may not succeed this year. That’s why staying on top of trends at all times is very important.
In this post, we bring to you the latest Facebook stats along with our analysis, in categories that matter to marketers. You can leverage our insights to craft on-target marketing plans for your brand.
30+ Incredible Facebook Stats Every Marketer Should Know:
Facebook Stats That Marketers Should Know
We have curated facts and figures about Facebook marketing from reliable sources for you. Just jump to the group of stats that interests you.
Statistics About Facebook Demographics
The first step in creating an effective marketing plan is to research your target audience. This group of stats will give you clarity about various aspects of your users, including their age, gender, education, income, and motivators.
- Age and Gender Composition of Users
Males in the 25-34 years age bracket are the biggest Facebook demographic, making up almost 19% of the total user base. Males are also more active on the platform than females.
It seems that younger users are more active on competitor platforms like Instagram and YouTube, according toPew Research. From 71% in 2015, the volume of 13-17 year olds on Facebook fell to 51% in 2019.

Source:statista.com
令人惊讶的是,65年以上年龄段的消费者(aka “Silents”) are becoming avid Facebook users. This demographic has grown by14%during 2018-19, which is maximum among all the assessed age groups.

Image via Quartz
- Income Bracket of Users
Facebook is the second most-used social network by users in thehigh-income group(those earning more than $75 K yearly). Only YouTube surpasses Facebook in this regard. Even LinkedIn ranks lower than Facebook despite being the preferred platform for professionals and business owners.
- Educational Background of Users
Facebook users are not only earning well, they are also well-educated.75%of them are college graduates, according to a 2019 report by Statista.

Image via Statista
- Usage Reasons
People visit Facebook for a variety of reasons. 88% of Americans use it to keep in touch with friends and family, 33% to get entertainment, 23% to get news, and 17% to follow brands.

Statistics About Facebook Usage
Now that you know more about the audience on Facebook, let’s take a look at how you can reach them. The stats in this section will guide you.
- Usage
As of Q1, 2020, Facebook had more than2.6 billionmonthly active users (MAU). Out of this, 67% of users log in daily on the platform. Going by audience volume, Facebook is the most popular social network in the world.

Image via Statista
Facebook is a clear favorite of businesses as well. Almost140 millionbrands, mostly SMBs (small- and mid-sized businesses), use the platform monthly to search for new selling opportunities, build brand awareness, and connect with customers.
- Reach
If we talk about reach, Facebook accounts for45%of monthly social visits around the globe. In the U.S., Facebook is the most visited social network, garnering55.9%of all social media visits in February 2020.
Strong mobile integration and instant messaging service are responsible for Facebook’s popularity among the masses. After WhatsApp, Facebook’s Messenger is thesecond-most popularinstant messaging app.
- Geography
With280 millionusers, India has the most Facebook users, followed by the U.S., Indonesia, and Brazil.
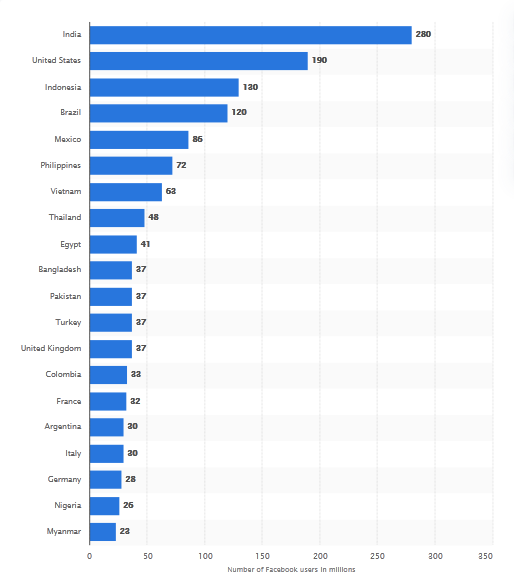
Image via Statista
Although Asia-Pacific region contributes nearly41.3%of Facebook MAU, the U.S. and Canada regions are equally if not more important to marketers. That’s because 48% of Facebook’s ad revenue came from these markets alone in Q3 of 2019.
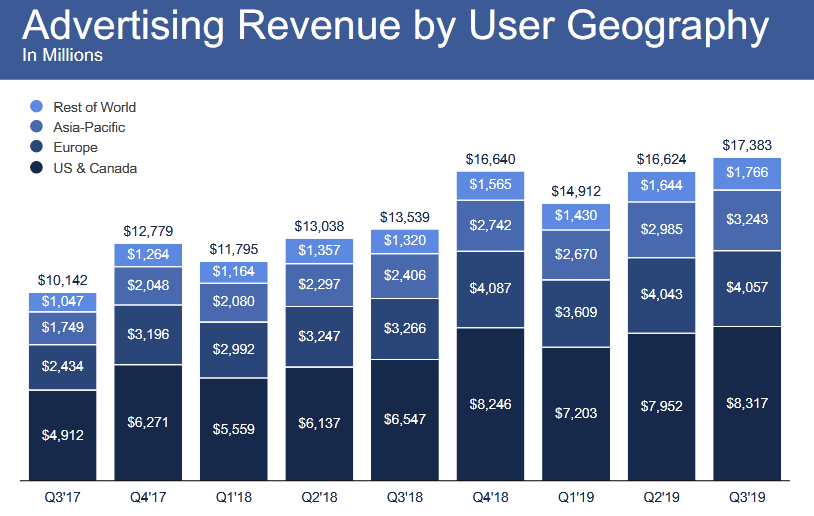
Image via Facebook
- Device
Nearly78%of Facebook users access the platform via only mobile phones, whereas 20% via both computers and phones. Only-desktop traffic comprised only 1.8% of the total traffic. There are 1.59 billion mobile users of Facebook. This means your marketing content and strategy should be made with a mobile-first approach.

Image via Statista
- Content
Stories have a loyal fan base on Facebook and Messenger. There are about500 million+active users who check Facebook and Messenger Stories daily.

Image via Techcrunch
Statistics About Facebook Ads
With a potential reach of1.9 billion, Facebook Ads are a goldmine for marketers. Take a look at some important stats on advertising revenue, costs, and content.
Number of Active Advertisers
In Q1 of 2020, there were about8 millionactive advertisers on Facebook, who were using the platform to market their products and services.
Revenue Contribution
A whopping95%Facebook的收入来自广告,of Q3, 2019. As explained earlier, a big part of this revenue was generated from consumers in the U.S. and Canada.

Image via Facebook
Facebook users in the U.S. and Canada are generating average revenue of $34.55 per user, out of which $33.86% is spent on Facebook ads. The next most profitable demographic is from Europe, followed by Asia-Pacific.

Image via Facebook
Instagram was acquired by Facebook in 2019. Since then, Instagram advertising has been contributing to Facebook’s advertising revenue in a big way. Its share is about31.8%. To get the best returns from Facebook marketing, smart marketers should leverage Instagram as well.
Mobile Advertising
Mobile devices are a top grosser for Facebook advertisers. Nearly92%of advertising revenue came from mobile phones in 2018 (amounting to $50.6 billion). This figure is projected to rise in the coming years. Experts predict that by 2021, mobile ad revenue of Facebook will cross $60 billion.

Image via Statista
Ad Content
Almost half of the total mobile ad revenue came from sponsored Stories ads. By 2021, this amount in dollars is projected to be$31 billion.
Ad Costs
The average advertising cost decreased by6%in Q3 of 2019. There’s more good news in store for marketers. There was a 37% increase in ad impressions during this period, mostly owing to Stories ads and Newsfeed ads. This means ads will deliver more value for money in coming time.
如果你需要准确的数字来计划你的advertising budget, you should know that the average cost per click of Facebook ads is around$1.42.

Image via Wordstream
When we talk about costs, we also need to delve into the topic of conversion opportunities. The average conversion rate of a Facebook ad is around 9.21%.

Image via Wordstream
As you can see from the above graphics, CPC and conversion rates vary widely across industries. So, while planning your Facebook ad campaigns, take a look at these figures for your industry. If the cost is too high and the conversion rate too low, perhaps advertising on Facebook is not the best marketing tactic for you.
Statistics About Facebook Videos
- According to Statista,videosare the most-consumed content type on Facebook. Posts with videos get an engagement rate of 6.15%, whereas status-type posts get only 1.38%.
- Videos provide a multi-dimensional experience to viewers, which is why they are more engaging.Insightsfrom Facebook state that social media users spend only 1.7 seconds checking out a post. They recall the viewed content for just 0.25 seconds.
Since videos engage viewers longer, they are retained better. For marketers, videos are a great way to draw the attention of click-happy users and make an impression in split seconds.
- Understanding the impact of videos, more and more people have started using videos in their Facebook content. In 2018,11%of all Facebook posts were videos. They included video posts, video ads, live streams, and video Stories.

Image via Quintly
- Larger profiles (with 10 million+ fans) posted more videos than others. In fact,20%of their content is videos.

Image via Quintly
- As mentioned earlier, video ads constitute half of all Facebook ads. To increase the view time of your video ads by12%, Facebook recommends adding captions to your ads. Video ads are super-effective marketing tools. They are found to deliver 74% of their value in the first 10 seconds and 47% in the first three seconds.
- While creating video content for Facebook, ensure that you disable the auto-play sound feature.80%of users get annoyed when videos play sounds when they are launched, instead of giving viewers an option to unmute. That’s probably why 85% of users watch videos with their sound off.
- If you have the option of going live on Facebook, grab it with both hands. Facebook Live’s view time has multipliedfour timesfrom 2019-20. So, it’s time that you explore your spontaneous side by livestreaming on Facebook.
Wrapping Up
Facebook marketing can give rich dividends, especially if it’s done in a well-planned manner. If your marketing plan is based on real facts and figures instead of assumptions, you can proceed more confidently. The stats included in this post will give you a solid base to craft your marketing plan.